
Tradingview crypto analysis tutorial
Introduction
Ever wondered how the pros make sense of the complex world of cryptocurrency markets? They use powerful tools like Tradingview to analyze trends and make informed trading decisions. This tutorial will guide you through the basics of using Tradingview for crypto analysis, ensuring even beginners can start to trade like a pro. Ready to unlock the secrets of crypto trading? Let’s dive in!
Getting Started with Tradingview
When you’re new to Tradingview, the key is to start simple and gradually scale up your proficiency with the tool. Here’s a step-by-step guide to help you begin:
Sign Up and Log In
First things first, you need to create an account on Tradingview. Visit their website, click on the sign-up button, and follow the prompts to register. You can start with a free account which offers ample functionality for beginners. Once you’ve signed up, log in to access your dashboard.
Familiarize Yourself with the Interface
Tradingview’s interface might look overwhelming at first with its graphs, numbers, and technical indicators. Spend some time navigating around. Identify where the main features are located, such as the charting area, the different types of charts available, the toolbar for analysis tools, and where to find market data.
Set Up Your Profile
Customize your profile according to your trading preferences. You can set up your profile by selecting the markets and cryptocurrencies you’re most interested in. This customization will make your dashboard more relevant to your trading needs and goals.
Explore the Chart
The chart is the heart of Tradingview. Start by selecting a cryptocurrency you are interested in from the “ticker” search bar at the top. Once selected, the price chart of that cryptocurrency will appear. You can adjust the time frame of the chart (e.g., 1 minute, 1 hour, 1 day) to view historical performance over different periods.
Learn to Use Basic Tools
Begin with simple tools to draw on your charts. Learn how to use:
- Trend lines: These are straight lines drawn on the chart to identify and mark out the directional movement of a cryptocurrency’s price.
- Support and resistance levels: These are horizontal lines that represent the levels at which a lot of buyers or sellers have entered the market.
These tools will help you understand the basic movements in the market and start to develop your own analysis.
Practice with Demo Trading
Tradingview offers a feature called “paper trading” which allows you to simulate trading without using real money. This is a fantastic way to practice your skills, test strategies, and get a feel for market movements without financial risk.
Join the Community
Tradingview has a vibrant community of traders and analysts. Engage with the community by following popular profiles, participating in discussions, and even sharing your own charts and analyses. Learning from others can accelerate your understanding of the markets.
Keep Learning
Finally, make use of the vast amount of educational content available on Tradingview. There are tutorials, guides, and videos that can provide further insights into market analysis, trading strategies, and the use of various indicators and tools.
By following these steps, you’ll set a solid foundation for your journey into crypto trading using Tradingview. Remember, the key to mastery is consistent practice and continuous learning. Happy trading!
Understanding the Dashboard
The Tradingview dashboard serves as your command center. It is where you access all the tools and data necessary for effective trading analysis. Here’s how to navigate and utilize it to its full potential:
Overview of the Dashboard
Upon logging in, you’ll be greeted by the main dashboard. This area typically displays:
- Watchlist: Your selected list of cryptocurrencies and other financial instruments.
- Price Charts: Visual representations of price movements.
- Tool Panel: A selection of tools and functions for charting and analysis.
- News and Alerts: Updates and notifications related to market events and price movements.
Understanding each segment will help you customize and use Tradingview more efficiently.
Customizing Your Watchlist
Your watchlist is crucial because it keeps you updated on the performance of the cryptocurrencies you are interested in. To add or remove items:
- Click on the ‘+’ symbol or search bar in the watchlist panel.
- Type the name or ticker of the cryptocurrency.
- Select it to add it to your list.
You can create multiple watchlists if you want to track different types of assets or strategies separately.
Navigating Price Charts
The central feature of Tradingview is its interactive charts. Here you can:
- Change the layout: Adjust the number of charts displayed, from a single view to a multi-chart layout.
- Adjust time frames: Select different time intervals for the charts (e.g., 1-minute, 4-hour, daily).
- Apply technical indicators: Add indicators like Moving Averages, RSI, or Bollinger Bands from the indicators menu.
Utilizing Analysis Tools
To the left of the chart, you’ll find the toolbar containing various analysis tools. These include:
- Drawing tools: For drawing trend lines, channels, Fibonacci retracements, and more.
- Annotation tools: For adding text notes or highlighting key areas on your charts.
- Measurement tools: To measure price changes and time intervals.
Experiment with these tools to understand how they can enhance your analysis and trading decisions.
Setting Alerts
Stay ahead of market movements by setting up alerts. You can set alerts based on price levels, indicator values, or even drawing tools. When the set conditions are met, you’ll receive a notification. This feature helps you manage your trades without needing to constantly monitor the charts.
Accessing News and Social Insights
The bottom or side panel typically contains news feeds and social trading insights. Here you can:
- Follow market news: Stay updated with the latest news affecting the crypto markets.
- Engage with the community: See posts and ideas from other traders. You can learn from their insights and share your own.
Utilizing Token Metrics AI for Smarter Trading
In addition to the features on the dashboard, consider incorporating Token Metrics AI into your trading strategy. This powerful AI-driven platform provides in-depth insights, price predictions, and ratings for cryptocurrencies, helping you make smarter investment decisions. Learn more about how it can transform your trading approach here: Token Metrics AI
Exploring Additional Features
Don’t forget to explore other features like:
- Market summaries: Quick snapshots of market performance.
- Economic calendars: Information on upcoming economic events that could impact the markets.
- Trading panel: Direct trading capabilities through connected brokers.
By becoming familiar with the Tradingview dashboard and integrating tools like Token Metrics AI, you can turn it into a powerful ally in your trading journey. Each section of the dashboard is designed to provide you with comprehensive tools and data to make informed trading decisions efficiently.
Setting Up Your First Chart
Creating and customizing your first chart on Tradingview is a critical skill for analyzing crypto markets. This step-by-step guide will walk you through how to set it up and tailor it to your trading needs.
Selecting the Cryptocurrency
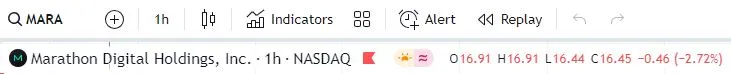
- Search for Your Cryptocurrency: At the top of the dashboard, there’s a search bar. Here, type the name or the ticker symbol of the cryptocurrency you are interested in analyzing. For example, if you want to look at Bitcoin, you could type “BTC”.
- Choose the Market: Once you enter the name, you’ll see a list of markets where the cryptocurrency is traded, like BTC/USD on Coinbase, BTC/USDT on Binance, etc. Select the one that you prefer or follow most often.
Choosing the Chart Type
Tradingview offers several types of charts that help in different kinds of analysis:
- Line Chart: This is the simplest form, showing just the closing prices. It’s useful for a quick glance at market trends.
- Bar Chart: Each bar represents one period (like a day or an hour) and shows the opening, closing, high, and low prices.
- Candlestick Chart: Similar to bar charts but easier to read, with color coding to indicate price movement (green for up, red for down). Most traders prefer candlestick charts for detailed analysis.
To change the chart type, look for the chart type icon near the top of the chart area and select your preferred format.
Adjusting the Time Frame
The time frame of a chart affects how much detail you can see. Shorter time frames (like 1-minute or 5-minute charts) are used for day trading, while longer time frames (like daily or weekly charts) are better for long-term trend analysis.
- Change the Time Frame: Use the time frame selection tool at the top of the chart to choose the interval that best suits your trading strategy.
Adding Technical Indicators
Technical indicators are crucial tools for analyzing market trends, momentum, volume, and other aspects.
- Access the Indicators Menu: Click on the “Indicators” button at the top of the chart. This opens a menu with hundreds of indicators.
- Search and Select Indicators: You can search for specific indicators like “RSI” or “MACD” or browse through categories. Click on an indicator to add it to your chart.
- Customize Indicators: Once added, you can customize each indicator’s parameters and appearance to match your analysis needs.
Utilizing Drawing Tools
Drawing tools help you mark important price levels, trends, and patterns on the chart.
- Access Drawing Tools: On the left side of the chart, you’ll find icons for various drawing tools like trend lines, channels, Fibonacci retracements, and more.
- Apply Drawing Tools: Select a tool, then click and drag on the chart to apply it. These tools can be customized and moved around as needed.
Saving Your Chart Layout
Once you’ve set up your chart with the right indicators and tools, you can save this layout.
- Save the Layout: Click on the “Cloud” icon to save your setup. This allows you to quickly load your preferred setup on any device.
Practice and Experiment
The key to mastery is practice. Spend time experimenting with different settings, indicators, and tools. Over time, you’ll discover what combinations work best for your trading style.
By following these steps, you can effectively set up your first chart on Tradingview. This setup will serve as a fundamental component of your crypto trading analysis, helping you make informed decisions based on trends and patterns you observe in the market.
Exploring Basic Analysis Tools
Tradingview is equipped with a wide range of tools that help traders analyze market conditions, identify trends, and make predictions. Here’s how to utilize some of the fundamental tools effectively.
Trend Lines
Trend lines are among the most basic yet powerful tools for technical analysis. They are used to connect two or more price points to identify support and resistance levels and to spot potential trend reversals.
- How to Use Trend Lines: Click on the trend line tool from the left toolbar, then click on the chart where you want the line to start, and drag to where you want the line to end. It’s important to align trend lines with significant price points like highs or lows. A trend line can give you insights into the market direction and help you make predictions about future price movements.
Horizontal and Vertical Lines
These lines are used to mark specific price levels (horizontal) or specific times (vertical) on a chart, which can be critical in defining boundaries for price movements.
- Setting Horizontal Lines: Use them to mark areas where the price has historically found support or resistance. By identifying these levels, you can better predict points where the price might struggle to move higher or lower.
- Using Vertical Lines: These can be useful for marking the dates of significant events such as product launches, earnings announcements, or macroeconomic events, and observing how such events have historically impacted prices.
Channels
Channels are two parallel trend lines that enclose price movements. They can be ascending, descending, or horizontal, indicating the direction of the market trend.
- How to Draw Channels: Select the channel tool from the toolbar. Start by drawing the first line, which is typically set at the lows in an uptrend or highs in a downtrend. Then draw a parallel line at the opposing highs or lows. Channels help traders understand the range within which the market is moving and can indicate potential breakout points.
Fibonacci Retracements
This tool is used to identify potential reversal levels based on the Fibonacci sequence. Traders use these levels as indicators of where support and resistance might occur.
- Applying Fibonacci Retracements: After selecting the Fibonacci tool, place it at a swing high and drag it to a swing low. The tool automatically places horizontal lines at key Fibonacci ratios such as 23.6%, 38.2%, 50%, 61.8%, and 100%. These levels can act as potential support or resistance areas.
Moving Averages
Moving averages smooth out price data to create a single flowing line, making it easier to identify the direction of the trend. Common types include the Simple Moving Average (SMA) and the Exponential Moving Average (EMA).
- Adding Moving Averages: Find the moving average in the indicators menu, select it, and it will overlay on the chart. You can adjust the number of periods to make the moving average more responsive or smoother depending on your analysis needs.
Text and Annotations
Adding notes to your charts can help you keep track of your observations and thoughts at specific points in time.
- Using Annotations: Select the text tool from the toolbar, click on the desired location on your chart, and type your notes. This is particularly useful for keeping records of why certain decisions were made or reminding yourself of market conditions at a specific time.
Practice and Learn
The key to becoming proficient with these tools is practice. Try applying them in different market conditions and pair them with other forms of analysis, such as fundamental analysis or news events, to see how they can best be used to support your trading decisions.
By mastering these basic tools on Tradingview, you’ll be better equipped to navigate the complexities of the cryptocurrency markets and make more informed trading decisions.
Using Indicators and Oscillators
Indicators and oscillators are mathematical tools that analyze various aspects of price movement, such as trend, volume, and volatility, to help traders make more informed decisions. Here’s how to effectively use some of the most popular indicators and oscillators on Tradingview.
Relative Strength Index (RSI)
The Relative Strength Index (RSI) is a momentum oscillator that measures the speed and change of price movements. RSI oscillates between zero and 100 and is typically used to identify overbought or oversold conditions in a market.
- How to Use RSI: You can add RSI to your chart by selecting it from the ‘Indicators’ menu. Traditionally, an RSI above 70 indicates that an asset might be overbought, while an RSI below 30 might indicate that an asset is oversold. These levels can signal potential reversal points where traders might consider opening or closing positions.
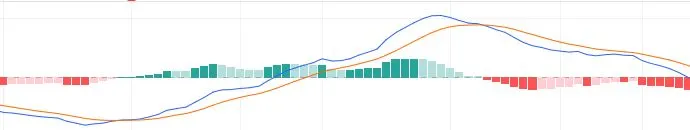
Moving Average Convergence Divergence (MACD)
MACD is a trend-following momentum indicator that shows the relationship between two moving averages of a cryptocurrency’s price. The MACD is calculated by subtracting the 26-period Exponential Moving Average (EMA) from the 12-period EMA.
- Applying MACD: Add the MACD to your chart from the indicators menu. The MACD consists of two lines: the MACD line and the signal line, along with a histogram. When the MACD line crosses above the signal line, it suggests a bullish signal, and when it crosses below, it suggests a bearish signal.
Stochastic Oscillator
This momentum indicator compares a particular closing price of a crypto to a range of its prices over a certain period of time. Its sensitivity to market movements can be adjusted by changing the time period or by taking a moving average of the result.
- Using Stochastic: Access this tool from the indicators list. The stochastic oscillator is displayed as two lines. The main line is called “%K,” while the second line, “%D,” is a moving average of %K. Typical settings are 14,3,3. Traders often look for a crossover above or below the 20 and 80 levels as signals of market reversals.
Bollinger Bands
Bollinger Bands consist of a middle band being an N-period simple moving average (SMA) along with an upper and lower band that are 2 standard deviations away from the middle band. This indicator provides insights into market volatility.
- Implementing Bollinger Bands: From the indicators menu, select Bollinger Bands and apply them to the chart. They help traders understand whether prices are high or low on a relative basis. When the bands contract, it indicates decreased volatility and when they expand, increased volatility. Traders might use these bands to predict long-term price movements.
Volume Oscillator
The Volume Oscillator measures the difference between a faster and slower moving average of volume. It helps identify whether the volume trend is increasing or decreasing, which can be crucial for confirming trend directions.
- Setting Up Volume Oscillator: Find this tool in the indicators section. A positive value typically indicates bullish trends, and a negative value indicates bearish trends, especially when accompanied by price movements.
Combining Indicators for Enhanced Analysis
Using multiple indicators together can provide a more robust analysis. For example, combining RSI with MACD can help confirm trend changes detected by MACD with momentum provided by RSI, reducing the likelihood of false signals.
Practice and Experimentation
The best way to learn the use of these indicators is through practice and experimentation. Use Tradingview’s paper trading feature to test how these indicators work together to form trading strategies without any financial risk.
By integrating these indicators and oscillators into your trading strategy on Tradingview, you can significantly enhance your ability to make informed trading decisions in the crypto market. Understanding how to interpret these tools correctly will allow you to better predict market movements and manage your trades effectively.
Customizing Your Tradingview Experience
Tradingview offers a flexible and user-friendly interface that can be customized extensively to enhance your trading analysis and efficiency. Here’s how you can make the most out of these customization features:
Layout Customization
- Multiple Chart Windows: Tradingview allows you to view multiple charts simultaneously. This is particularly useful if you are monitoring several cryptocurrencies or different time frames at once. You can arrange the charts in a grid, horizontally, vertically, or however suits your analysis style.
- Dark and Light Mode: Depending on your preference for screen visibility or just for aesthetic reasons, you can switch between dark and light modes. Many traders find the dark mode easier on the eyes, especially when analyzing charts for long periods.
Creating and Saving Chart Templates
- Save Your Setup: Once you’ve added indicators and set up your charts as you like them, you can save this setup as a template. Next time you analyze a different cryptocurrency, you can apply your template instead of setting up everything from scratch.
- Template Management: You can create multiple templates for different kinds of analysis—such as day trading, swing trading, or different asset classes. This not only saves time but also ensures consistency in your analysis.
Customizing Indicators
- Modifying Indicator Settings: Most indicators on Tradingview are customizable. You can change their parameters (like the length of moving averages), styles (like color, line thickness), and even the mathematical calculations if you’re familiar with coding through the Pine Script editor.
- Creating Your Own Indicators: For those who have knowledge of coding, Tradingview’s Pine Script language allows you to write custom scripts to create unique indicators tailored to your specific trading strategy.
Setting Alerts
- Price Alerts: You can set alerts on specific price levels, indicator conditions, or even drawing tool intersections. This feature ensures you don’t miss potential trading opportunities or important market movements.
- Custom Alerts: Alerts can be customized with specific messages, and you can choose how you want to be notified—via email, SMS, or on-screen pop-ups.
Using Drawing Tools Effectively
- Organizing Drawing Tools: Keep your most frequently used drawing tools easily accessible by customizing the toolbar. You can add, remove, or rearrange tools based on your preferences.
- Persistent Drawings and Annotations: You can choose to save your drawings and annotations on the chart even when you switch between different setups or templates, which helps in keeping track of your analysis over time.
Integrating Trading Panels
- Broker Integration: Tradingview allows direct integration with various brokerage platforms. This means you can trade directly from the Tradingview interface without needing to switch between applications.
- Customizing the Trading Panel: Configure the trading panel to display the information you need most, such as order history, available balances, or even news feeds related to your trades.
Accessibility and Usability Enhancements
- Keyboard Shortcuts: Learning and customizing keyboard shortcuts can significantly speed up your analysis. Tradingview lets you set shortcuts for almost any action, from changing chart types to adjusting indicator settings.
- Mobile Customization: The Tradingview app on mobile devices also offers customization options, ensuring you can trade on the go without losing your personalized setup.
By customizing your Tradingview experience, you can streamline your workflow, enhance your analysis capabilities, and ultimately make more informed trading decisions. Each trader’s needs and preferences are different, so take the time to explore and adjust the settings to suit your specific requirements. This personalized approach will help you leverage Tradingview’s full potential in your trading endeavors.
Practical Trading Strategies
Trend Following
One of the most popular strategies in trading is trend following. This strategy involves identifying a trend and placing trades in the direction of that trend.
- Using Moving Averages: Apply moving averages like the 50-day or 200-day SMA to determine the trend. A price above a rising moving average suggests an uptrend, while a price below a declining moving average suggests a downtrend.
- Incorporating MACD: The MACD can be used to confirm the strength of the trend. A positive MACD indicates that the trend is strong and likely to continue.
Swing Trading
Swing trading involves taking trades that last from a day to several weeks to profit from expected upward or downward moves in the market.
- Utilize RSI and Stochastic: These oscillators can help identify overbought or oversold conditions, suggesting potential reversal points. For instance, an RSI or Stochastic value below 30 often indicates an oversold condition, possibly a buying opportunity in an uptrend.
- Apply Fibonacci Retracements: To identify potential support or resistance levels during pullbacks in a trend, which can be ideal entry or exit points.
Scalping
Scalping is a strategy used to make profits on minor price changes, and traders who implement this strategy make tens or hundreds of trades per day.
- Use Short Time Frames: Charts with 1-minute to 5-minute time frames are typical for scalpers. Using indicators like Bollinger Bands or volume-weighted moving averages (VWAP) can help identify small price movement patterns.
- Set Tight Stop-Losses: Given the high speed of trading, it’s crucial to manage risk with strict stop-loss orders to minimize potential losses.
Breakout Trading
This strategy involves identifying key levels that the price of an asset has not been able to break through (support or resistance), and then entering a trade as the price breaks through these levels.
- Draw Support and Resistance Levels: Use horizontal lines to mark these levels based on historical price peaks and troughs.
- Watch for Volume: An increase in volume during a breakout is a good confirmation that the breakout is legitimate.
Counter-Trend Trading
This strategy involves trading against the prevailing market trend in the belief that markets overextend and then revert to previous levels or averages.
- Identify Potential Reversal Points: Tools like RSI and Fibonacci can help find potential reversal areas.
- Look for Divergence: Divergence occurs when the price is moving in one direction and an indicator (like RSI or MACD) is moving in another. This can often signal a potential reversal.
Risk Management
No matter which strategy you choose, effective risk management is crucial. Always know how much of your capital you are risking on any trade. A common rule is not to risk more than 1-2% of your account on a single trade.
Testing and Refinement
Before applying these strategies in live markets, use Tradingview’s paper trading feature to test them out without financial risk. Monitor performance and refine your strategy based on the results.
Stay Informed
Continuously educate yourself on market conditions, news, and developments. Use Tradingview’s news integration and economic calendar to stay updated with events that could impact your trading strategies.
By implementing these practical trading strategies with the help of Tradingview’s comprehensive tools, you can enhance your trading acumen and potentially increase your success in the cryptocurrency markets. Always remember to adapt your strategies to align with your trading style, risk tolerance, and market conditions.
Tips for Effective Crypto Analysis
Understand Market Cycles
Cryptocurrencies tend to follow market cycles which include periods of high volatility and phases of consolidation. Recognize these patterns:
- Bull Markets: Identify signs of bullish trends like higher highs and higher lows, and use momentum indicators to confirm trend strength.
- Bear Markets: Notice lower lows and lower highs. Defensive strategies such as short selling (where permitted) or moving to stablecoins can be considered.
Use a Combination of Indicators
Relying on a single indicator can often lead to misleading signals. Combine different types of indicators to confirm your analysis:
- Trend Indicators: Like moving averages and MACD can be used to identify the direction of the market.
- Momentum Indicators: Such as RSI and Stochastic can help determine the strength of the trend and potential reversal points.
- Volume Indicators: Look for volume to confirm the strength of a breakout or reversal.
Stay Updated with News and Events
Cryptocurrency prices can be highly sensitive to news and global events:
- Regulatory News: Stay informed about government regulations concerning cryptocurrencies which can significantly impact market sentiment.
- Technological Developments: Updates like forks, protocol upgrades, or new blockchain integrations can affect prices.
- Economic Indicators: Global economic changes can influence cryptocurrency markets. Use Tradingview’s economic calendar to keep track of such events.
Manage Risks
Effective risk management is key to successful trading:
- Set Stop-Loss Orders: Always set stop-loss orders to limit potential losses. This is especially important in the volatile crypto market.
- Use Risk-Reward Ratios: Aim for trades where the potential reward justifies the risk. A common approach is to look for a risk-reward ratio of at least 1:3.
Keep a Trading Journal
Maintain a journal of your trading activity where you document trades and note your strategies, successes, and failures:
- Record Trade Details: Include entry, exit, the reason for making the trade, and any other relevant observations.
- Review Regularly: Periodically review your journal to learn from past trades and refine your strategies.
Leverage Social Trading Features
Tradingview and other platforms offer social trading features where you can follow other traders, share insights, and learn from the community:
- Follow Experienced Traders: Learn from their strategies and market insights.
- Participate in Discussions: Engage with the community to exchange ideas and stay informed about market trends.
Continuous Learning
The crypto market is continuously evolving. Regularly educate yourself on new tools, investment strategies, and market dynamics:
- Online Courses and Webinars: Take advantage of educational resources offered by Tradingview and other platforms.
- Read Extensively: Stay informed about cryptocurrency and blockchain technology trends through books, articles, and research papers.
Backtest Your Strategies
Before applying a new strategy in live markets, backtest it using historical data to see how it might have performed in the past. Tradingview’s backtesting tools can help you do this effectively.
By applying these tips, your crypto analysis will become more structured and informed, potentially leading to better trading decisions. Remember, consistent application and continuous improvement are key to becoming proficient in crypto analysis.
Avoiding Common Pitfalls
Navigating the volatile world of cryptocurrency trading can be challenging, and even seasoned traders can fall into common traps. Here are some tips to help you avoid typical pitfalls and improve your trading outcomes.
Overtrading
Overtrading is a common mistake, especially in highly volatile markets like cryptocurrency. It often leads to increased fees and poor decision-making.
- Set Clear Goals: Before you begin trading, define what you want to achieve and set measurable targets.
- Quality Over Quantity: Focus on making fewer, well-considered trades rather than a large number of hasty decisions.
Ignoring Risk Management
Effective risk management is critical to long-term success in trading. Neglecting this aspect can lead to significant losses.
- Use Stop-Loss Orders: Always set stop-loss orders to automatically close a trade at a predetermined level to limit potential losses.
- Manage Your Exposure: Do not allocate more than a small percentage of your total investment capital to a single trade.
Letting Emotions Guide Trading Decisions
Emotional trading can lead to irrational decisions, such as chasing losses or becoming overly greedy during profitable phases.
- Stick to Your Plan: Always follow your trading plan and only make adjustments based on analytical changes, not emotional reactions.
- Take Breaks: If you find yourself feeling overly stressed or emotional, take a break from trading to reassess your strategy objectively.
Failing to Keep Up with Market News
Cryptocurrency markets are highly sensitive to news and global events. Ignoring these can cause you to miss important cues for market movements.
- Stay Informed: Regularly check cryptocurrency news sites, forums, and economic calendars.
- Use Alerts: Set up alerts on Tradingview for news events or significant price movements to stay on top of market developments.
Relying Too Heavily on Technical Analysis Alone
While technical analysis is a powerful tool, relying solely on it without considering fundamental and sentiment analysis can lead to incomplete insights.
- Combine Analysis Types: Integrate fundamental analysis to understand the broader market conditions and sentiment analysis to gauge market emotion.
- Diversify Your Tools: Use a range of analytical tools and indicators to get a comprehensive view of the market.
Underestimating or Ignoring Fees
Transaction fees, trading fees, and funding rates can all eat into your profits, especially if you are making many trades.
- Account for Fees: Always consider the impact of fees when calculating potential profits and losses.
- Choose Your Platform Wisely: Select trading platforms that offer competitive fees and consider fee structures in your trading strategy.
Neglecting Security
In the world of cryptocurrency, security breaches can lead to substantial financial loss. Ensuring the security of your funds is paramount.
- Use Reputable Platforms: Only trade on well-known and secure platforms.
- Secure Your Investments: Use strong passwords, enable two-factor authentication, and consider using cold storage for large balances.
Chasing ‘Hot Tips’
Chasing tips or trends without doing your own research is risky. Often, by the time information is widely known, the best opportunities have passed.
- Do Your Homework: Research any tips or trends thoroughly before acting on them.
- Be Skeptical: Approach hot tips with caution, especially those coming from unverified sources.
By being aware of these common pitfalls and actively working to avoid them, you can improve your decision-making process and increase your chances of successful trading. Remember, the goal is to develop a disciplined, informed trading approach that can withstand the ups and downs of the cryptocurrency markets.
Keeping Up with Updates and New Features
Keeping up with updates and new features in Tradingview and the broader cryptocurrency market is crucial for maintaining a competitive edge. Here’s how you can stay informed and adapt to changes effectively.
Regularly Check for Platform Updates
Tradingview and other trading platforms frequently update their features to improve user experience and offer new analytical tools.
- Follow Release Notes: Most platforms publish release notes or update logs on their websites or through newsletters. Make it a habit to review these notes to understand the changes and new features.
- Participate in Beta Tests: If available, participate in beta versions of the software to get early access to new features and provide feedback.
Utilize Educational Resources
As new features are released, platforms often provide tutorials and documentation to help users understand and utilize them effectively.
- Watch Tutorial Videos: Platforms like Tradingview often release video tutorials or webinars explaining how to use new features.
- Read Blogs and Articles: Keep an eye on the platform’s blog or articles written by other users that delve into new features and updates.
Engage with the Community
The community surrounding platforms like Tradingview can be a great resource for learning and staying updated on changes.
- Join Forums and Discussion Groups: Engage with other users in forums or groups to share insights and learn from others’ experiences with new updates.
- Follow Influential Traders: Influential traders often provide insights and tips on making the most of new tools and features in their trading strategies.
Subscribe to Newsletters
Many platforms offer newsletters that include information about upcoming updates, feature changes, and tips for traders.
- Opt-In for Email Updates: Ensure you are subscribed to receive emails from Tradingview and other trading platforms to get direct updates on new releases and features.
- Regularly Check Your Email: Make it a part of your routine to check for such updates in your inbox.
Attend Webinars and Online Conferences
Webinars, virtual conferences, and live streams are valuable for learning about advanced features and strategies directly from experts.
- Sign Up for Webinars: These often include live demonstrations of new features and Q&A sessions where you can ask specific questions.
- Attend Virtual Conferences: These can provide deeper insights into the platform’s capabilities and future roadmap.
Practice with New Features
Once you learn about new features, integrate them into your trading practice to understand their practical application and impact.
- Set Up a Test Environment: Use the paper trading feature or a demo account to experiment with new tools and features without financial risk.
- Evaluate Effectiveness: Assess how these new features can be incorporated into your existing trading strategy and what adjustments might be necessary.
Monitor Market Trends
Staying updated isn’t just about software features—it’s also about keeping an eye on broader market trends that can affect trading.
- Follow Industry News: Keep up with news from the crypto industry, including technological advancements, regulatory changes, and economic factors.
- Use Economic Calendars: Tools like Tradingview’s economic calendar can help you stay aware of major events that might influence market conditions.
By actively keeping up with updates and continuously educating yourself about new features and market trends, you can maintain a cutting-edge trading strategy. This proactive approach will help you adapt quickly to changes and potentially leverage new tools to improve your trading performance.
Conclusion and Further Resources
As we wrap up this comprehensive guide on utilizing Tradingview for crypto analysis, let’s summarize the key points and explore additional resources that can further enhance your trading skills and market understanding.
Key Takeaways
- Foundation is Key: Understanding how to set up and customize your charts on Tradingview is essential. Mastery of basic and advanced tools will enhance your analysis capabilities.
- Integrated Approach: Employ a combination of technical, fundamental, and sentiment analysis to inform your trading decisions. No single tool or method can provide complete market insights.
- Continuous Learning: The landscape of cryptocurrency trading is dynamic. Staying updated with new tools, features, and market trends is crucial for maintaining an edge.
Further Learning Resources
To continue developing your trading skills and staying informed about the latest in crypto analysis, consider the following resources:
- Trading Courses: Online platforms like Coursera, Udemy, and Khan Academy offer courses ranging from beginner to advanced levels in trading and financial analysis.
- Books and eBooks: Titles such as “Technical Analysis of the Financial Markets” by John J. Murphy provide a deep dive into technical analysis tools and techniques.
- Podcasts and YouTube Channels: Subscribe to popular trading podcasts and YouTube channels to receive regular updates and insights from experienced traders and market analysts.
- Trading Simulators: Use simulators to practice your trading strategies without financial risk. Many platforms offer simulation features that mimic real-world trading conditions.
- Webinars and Workshops: Many brokers and trading platforms host webinars and workshops, providing valuable opportunities to learn directly from trading professionals.
Community Engagement
- Join Trading Forums: Platforms like Reddit, Tradingview, and specialized trading forums offer communities for discussion, advice, and shared learning.
- Social Media Groups: LinkedIn and Facebook groups can provide networking opportunities and insights from other traders.
- Local Meetups and Conferences: Attending local meetups and industry conferences can help you connect with like-minded individuals and expand your professional network.
Keeping Up with News
- Cryptocurrency News Websites: Regularly visit sites like CoinDesk, CoinTelegraph, and CryptoSlate for the latest news and developments in the cryptocurrency world.
- Market Analysis Platforms: Beyond Tradingview, platforms like CoinMarketCap and CryptoCompare offer tools for market analysis and news updates.
Regulatory and Security Awareness
- Stay Informed on Regulation: Changes in cryptocurrency regulations can significantly impact market conditions. Follow regulatory news to stay compliant and informed.
- Prioritize Security: As a cryptocurrency trader, securing your investments should be a top priority. Educate yourself on best security practices and consider using hardware wallets for significant holdings.
In conclusion, using Tradingview for crypto analysis provides you with a robust suite of tools to analyze the markets effectively. However, the key to successful trading lies in continuous education, practical experience, and staying adaptive to market changes. By leveraging these resources and cultivating a disciplined approach to trading, you can enhance your ability to make informed decisions and achieve your trading goals.
FAQs
What is the best way to learn Tradingview?
Start by using the basic features and gradually explore more advanced tools as you gain confidence.
Can I use Tradingview for free?
Yes, Tradingview offers a free version with basic features, which is great for beginners.
How important are indicators in crypto analysis?
Indicators are crucial as they provide insights into market trends and potential reversals.
What should I do if I make a losing trade?
Analyze what went wrong, learn from it, and apply this knowledge to future trades.
How often should I check my Tradingview charts?
It depends on your trading style. Day traders may check constantly, while long-term traders might do so less frequently.